We're talking about Cowboy & Western movies today. I've got a dataset of movies with genre & year of release from IMDB.com. With this post, I'm also going to leave D3.js behind and start experimenting with some different JavaScript libraries that make it possible to present data in more playful ways.
So: Cowboy & Western movies. It's always seemed to me a great shame that the Western genre has fallen out of fashion. Or has it? This is the narrative I'd always had in my head: in the beginning, we had the blandly pleasant, almost childish Westerns of the 30's, 40's and 50's. Think John Wayne. Then, the golden age of the 60's with the gritty Spaghetti Westerns (A Fistful of Dollars, For a Few Dollars More, etc.). For the next couple decades there was a lull: just the odd, inconsequential movie. Finally, the genre was brought to a conclusion with Clint Eastwood's brilliant Unforgiven (1996). Unforgiven was so definitively the last word in Westerns that there was nothing left to say afterwards.
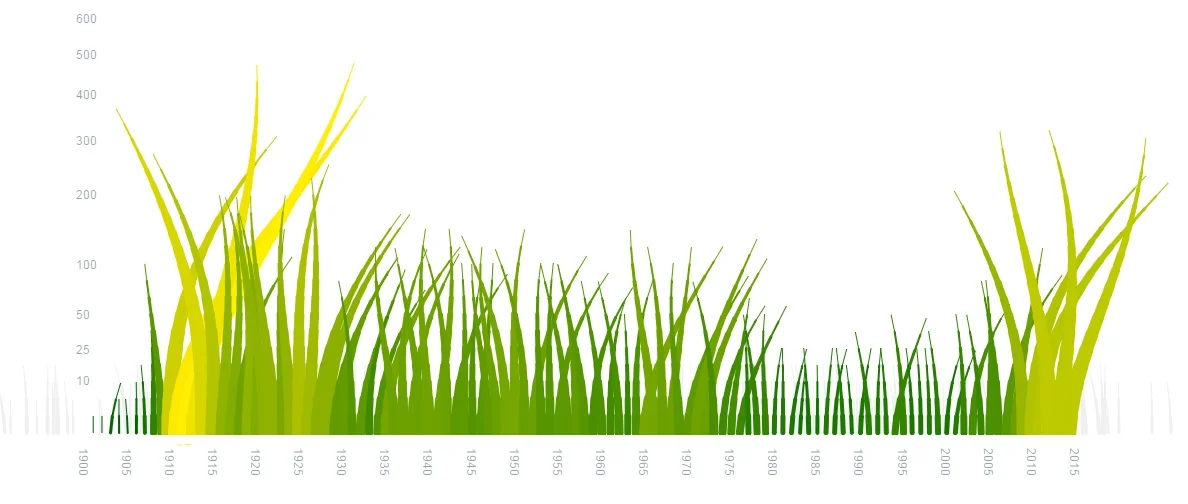
But it turns out I was completely wrong. Here's a plot of the number of Western movies per year:
Isn't this more fun than a boring bar chart? Thematically appropriate prairie grass :-) I'll talk a little about how the chart was created below.
But first, how wrong I was:
- By volume of films, the golden age was in the 1910s! Who knew?! Long before John Wayne and Clint Eastwood, the Western had already been at its most popular. ( See Wikipedia: List of Western films before 1920)
- The era of the Spaghetti Western was relatively quiet.
- Unforgiven was not the last word. In fact, there's been a resurgence of popularity, and throughtout the 2000's and 2010's the annual number of Western movies has risen dramatically. But things have changed. Take a look at Wikipedia's List of Western Films of the 2000s. Run your eye down the subgenre column: "Romance Western," "Horror Western," "Revisionist Western," "Space Western" ...
The plot
I mentioned in the introduction that I'm not using D3.js today. Whilst D3 makes it very easy to bind data to interactive HTML5 elements, that efficiency comes with a trade-off. It's great if you want create a type of chart that is built-in, and minor customisation is fairly easy, but if you want a more unconventional visualisation then D3 can be syntactically cumbersome.
For something like swaying grass, we're better to start with a library like Processing.js. Processing makes it easy to create looping animations.
A notable feature of of the swaying grass chart is the wind which makes the grass sway. When you make an animation like this, you want to inject some unpredictability into it to give it a feeling of life. This isn't as easy as you might think. Purely random data is erratic and jarring, and doesn't feel natural. In this chart, the wind is generated using Perlin noise. Perlin noise is pseudo-random data which varies gradually. It is widely used for creating behaviours and textures that feel natural. Processing has a built-in Perlin noise generator.
Attributions:
- My chart draws heavily on the Processing sketch Grass animated with perlin noise by Kasper Kristensen
- The data is from a dump of IMDB.com
The code is available in this github gist.
Bonus chart
Since I had this big chunk of IMDB data handy, I thought I'd try a time series chart:
- Use the legend ticks and radio toggles to change how it is displayed. I've disabled a few of the less interesting genres. You can also click on the name of a genre to toggle all others off.
- Use the range slider underneath to narrow the view
- Use the radio switches at the bottom to compare the absolute number of films with the proportion
See that Westerns as a proportion of all movies have definitely fallen out of favour. In 1925, 7% of films were Westerns; today it’s less than 1%. It would be very interesting to correlate these trends with macro behavioural data. For example, are there more war films during times of (probably US) military engagement?
One important caveat: some films in IMDB are tagged with multiple genres. A film might be Sci-Fi and Horror, for example. This creates a problem for visualising the data which I don't have time to solve today. In this chart, if a film has two genres then it is counted twice: once in each genre. (Yes, yes, that's a pretty big flaw, I know).
This chart is built with the great but woefully undocumented Rickshaw.js library.
Code in this github gist